Blog · forecasting
Why does a healthy pipeline still miss the forecast at €50k+?
A healthy pipeline misses when no-decision deals stay open at stage value, stages track seller activity and a few large deals swing the whole quarter.
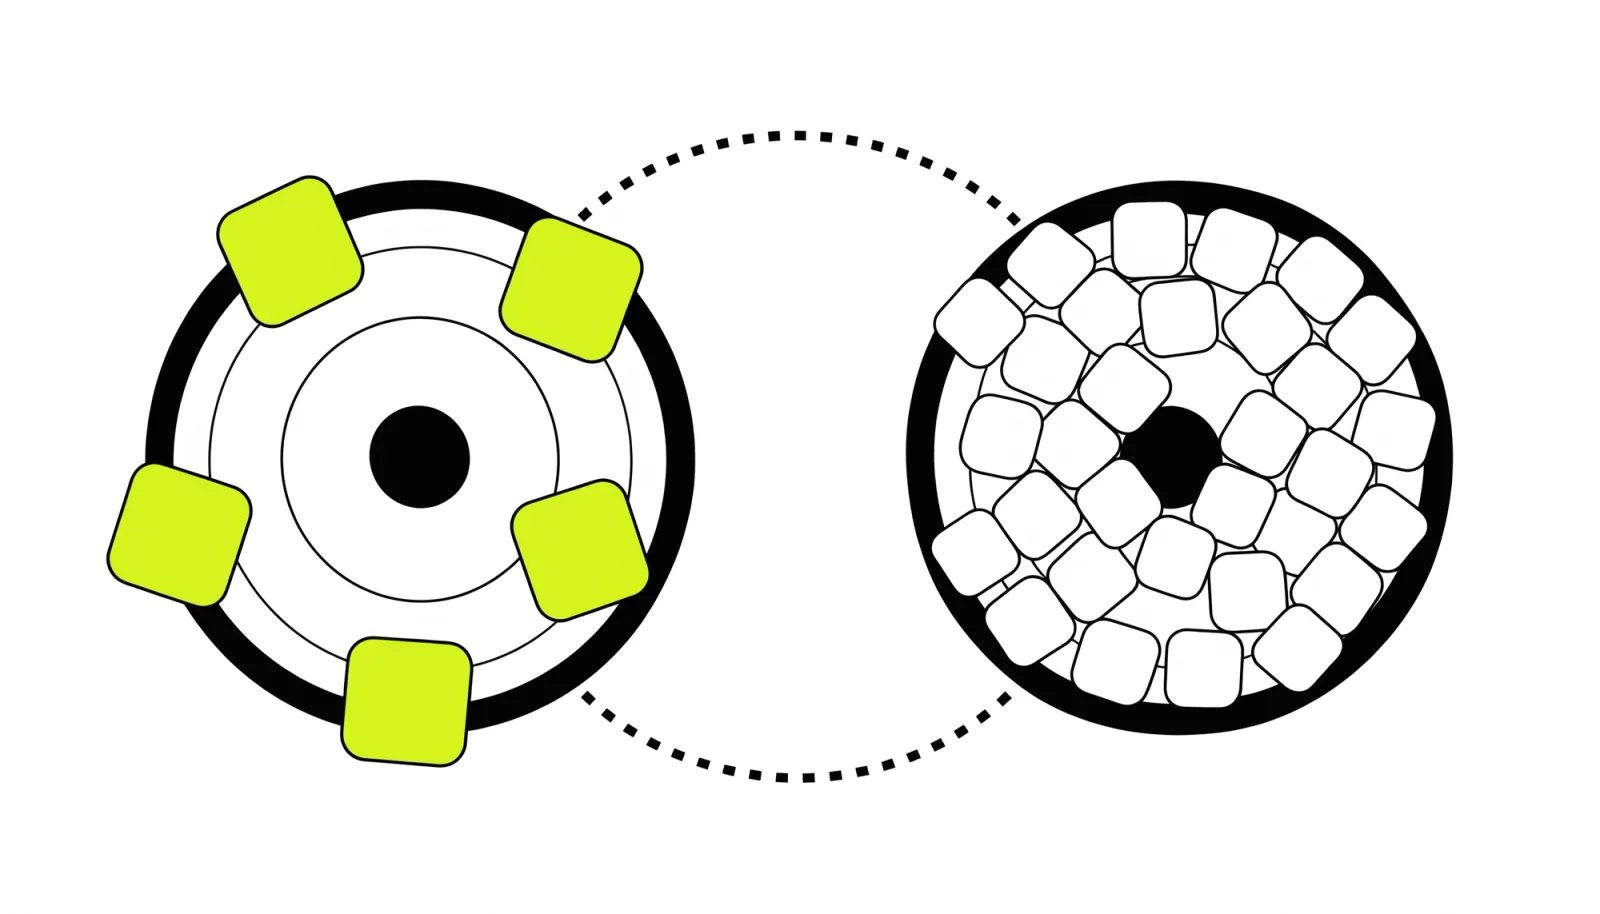
of deals lost to buyers who meant to buy but never acted (2.5M+ sales conversations)
Harvard Business Review, 2022typical swing of a quarter resting on 20 deals of €75k at honest 30% odds (Illustrative)
Panelhop, 2026chance a 20-deal quarter lands within 5% of forecast with honest odds (Illustrative)
Panelhop, 2026Why does a healthy-looking pipeline still miss the forecast?
A healthy-looking pipeline misses because “healthy” measures the value sitting in each stage. The forecast needs to know how much of it will close this quarter. That gap hides 3 things. Deals that will end in no decision stay open at full stage value. Stages record what the seller did rather than what the buyer agreed. And when a quarter rests on a few dozen large deals, it swings widely even when every probability is right.
Today’s top answers to this question list the familiar causes: rep optimism, inflated stages, close dates that slip. None of the ones we read gives a sourced figure. They leave out how often deals end with no decision at all, and how far a quarter of few, large deals moves on arithmetic alone. This guide adds both.
Stage definitions and slipped close dates are covered in our guide to pipeline coverage at €75k deals, so we don’t repeat them here. The model numbers below are Illustrative: arithmetic on stated assumptions, not measured data.
No-decision deals sit in the pipeline at stage value until someone closes them
A deal the buyer quietly drops rarely leaves the pipeline on its own, so it keeps counting at full stage value. It is also common. Matthew Dixon and Ted McKenna studied more than 2.5M recorded sales conversations, in transactional and complex sales.↗ They found that 40–60% of deals end up lost to customers who intended to buy but never acted.↗
A loss to a competitor is an event. The buyer usually tells you they chose someone else, and the rep marks the deal closed-lost. Indecision has no event. Meetings get moved, the champion goes quiet, the close date slides a month. Nobody closes the deal as lost, because nothing happened.
So the deal stays at “proposal” or “negotiation”, weighted at that stage’s odds, and next month’s pipeline looks as healthy as this month’s. At quarter end, the forecast misses by the deals that never moved.
Two changes make these deals visible:
- Give “no decision” its own closed-lost reason, separate from losses to a competitor. If your lost reasons rarely say no decision, look for those deals among the open ones.
- Close a deal out when its close date has moved twice with no new action from the buyer. A rep can reopen it the day the buyer comes back.
With 20 deals of €75k, honest odds swing a quarter by a third
A quarter that rests on 20 deals of €75k has a typical spread of ±34% around its €450k expected value (Illustrative).↗ That is about €150k either side, even when each deal’s 30% chance of closing is exactly right.↗ We call that honest odds: no rep optimism and no bad data, only arithmetic.
Spread the same €450k across more, smaller deals and the swing shrinks: ±24% with 40 deals of €37.5k, and ±11% with 200 deals of €7.5k.↗ The typical spread here is 1 standard deviation. The rule behind it: relative spread = √((1 − p) ÷ (N × p)), where N is the number of deals and p the chance that each one closes.↗ Quadruple the deals and the spread halves.
With the same €450k expected, a 20-deal quarter lands more than 25% off almost half the time.
Data behind this chart
| Item | Value |
|---|---|
| 20 deals of €75k | 47% |
| 40 deals of €37.5k | 23% |
| 200 deals of €7.5k | 2% |
The 20-deal quarter lands more than 25% above or below its expected value in about 47% of quarters, against about 2% for the 200-deal quarter.↗ A ±5% bar is harder still. With 20 deals, each one is a sixth of the quarter, so landing within 5% means winning exactly 6.↗ That happens about 1 quarter in 5, against about 41% of quarters with 200 deals.↗
This is the best case. The model assumes each deal closes on its own, at exactly the odds it was given. Real deals can share a cause, such as a budget freeze or a slow procurement quarter. When one cause moves several deals at once, the spread gets wider.
Where does the ‘93% can’t forecast within 5%’ figure come from?
It comes from a Clari blog post of 4 February 2020 that names no source, survey or sample.↗ The post says: “we’ve found that 93 percent of sales leaders are unable to forecast revenue within 5 percent, even with two weeks left in the quarter.”↗ Clari has since merged with Salesloft, and the guide now sits on Salesloft’s site, still without a method. Even with perfect odds, a 20-deal quarter clears that ±5% bar only about 1 quarter in 5.↗
Two more figures travel with it. The first is real, but it drifts as it is copied. Gartner’s State of Sales Operations Survey found that only 45% of sales leaders and sellers have high confidence in their organisation’s forecasting accuracy.↗ A vendor page updated in June 2026 says “45% of sales organizations” and dates the figure 2021.↗
The other, that only 7% of organisations reach 90% forecast accuracy, is credited to Gartner’s State of Sales Operations research.↗ The September 2026 page we found repeating it gives no year, sample or link.↗ We couldn’t check it at Gartner, so we don’t rely on it.
| Figure as it circulates | Where it comes from | What we found |
|---|---|---|
| 93% of sales leaders can’t forecast within 5% | Clari blog post of 4 February 2020, now on Salesloft’s site | No source, survey, sample or method |
| 45% have high confidence in forecast accuracy | Gartner’s State of Sales Operations Survey, press release of 12 February 2020 | Verified for sales leaders and sellers. A June 2026 vendor page makes it sales organisations and dates it 2021 |
| 7% of organisations reach 90% accuracy | Credited to Gartner’s State of Sales Operations research | Not verified: the page we found gives no year, sample or link, and we couldn’t check it at Gartner |
Of the 3 figures, only the 45% is verified at its source.↗ None of them tells you what accuracy your own deal count allows.
Coaching reps won’t fix stage data the forecast can’t trust
We think coaching reps harder rarely fixes a forecast that keeps missing on a healthy pipeline, because the miss usually starts in the data the forecast reads. It is a data problem before it is a talent problem.
Our reasons:
- The forecast reads the stage, and the stage can be wrong. A weighted forecast multiplies each deal by its stage’s odds. Say a deal reached “proposal” because the rep sent one, rather than because the buyer agreed a decision date. Coaching improves the rep’s notes and leaves the number where it was.
- Nobody owns a deal that went quiet. Closing out a no-decision deal takes a rule someone writes down. Until it exists, every rep carries those deals, however good they are.
- The survey data fits a system problem. Fewer than half of sales leaders and sellers are highly confident in their forecast accuracy, and Gartner names poor data quality as one of the main contributors to inaccurate forecasts.↗ We read that as a systemic problem rather than a few weak performers.
- With few large deals, hitting one number is mostly chance. Perfect data still leaves a 20-deal quarter swinging by about a third.↗ So we think a team whose quarter rests on a few dozen large deals should commit a range instead of a single figure. It should also name the deals that decide where in the range it lands. Held to a single number at those odds, reps are tempted to keep stalled deals open.
We don’t say coaching never helps: a rep who reads buyers well forecasts their own deals better. Clean data won’t make a 20-deal quarter predictable either. It makes the range honest and shows which deals decide it. And we don’t set a deal-size cutoff: your own deal count and win rate decide when one number stops being enough.
How do you forecast a quarter that rests on a few large deals?
Forecast it as a range sized by your own deal count. Do it after the no-decision deals are closed out and each late stage is tied to something the buyer did.
- 01Step 1
Count the deals
List the open deals that can close this quarter and take your win rate from the stage you count from. Put both into √((1 − p) ÷ (N × p)) to see how far honest odds can swing the quarter.
- 02Step 2
Close out no-decision deals
Close any deal whose close date has moved twice with no new buyer action, with “no decision” as the reason. Reopen it when the buyer comes back.
- 03Step 3
Tie late stages to buyer actions
A deal reaches a late stage only on something the buyer did: a decision date they agreed, a named signer, procurement started.
- 04Step 4
Calibrate the stage odds
Replace default stage probabilities with your own conversion from each stage over the last 4–8 quarters.
- 05Step 5
Commit a range and name the deals
Give the expected value with the spread from step 1, and list the deals that decide where in the range the quarter lands.
The arithmetic step changes what counts as a miss. With honest odds, a 20-deal quarter misses its expected value by about 27% on average, and a 200-deal quarter by about 9%.↗ For your own deal count, expect an average miss of about 80% of the spread from step 1.↗ Compare that with your actual average miss over the last 4–8 quarters. If yours is close, the range is the honest answer. If it is far above, fix the stages and the close-out rule first.
The stage and close-date fields carry most of this work, so they have to be reliable. The same fields decide whether AI deal-risk advice can be trusted, as we explain in is your CRM data clean enough for AI recommendations.

In practice
How we do it at Panelhop
In a Panel Check (GTM audit · 2–3 weeks), we rebuild your pipeline history from raw CRM records. We score whether stage exit criteria are enforced, the share of open deals whose close date has moved twice or more, how many closed-lost deals carry a usable reason and how far your week-4 forecast landed from what closed. You leave with a leak map, a baseline and a 90-day plan. The 8 areas the audit covers are in our GTM audit checklist.
If the stages need rebuilding, Leak Fix (we build the fixes) adds exit criteria, a required reason when a close date moves, a deal risk score and forecast tracking to the CRM you already use.
Questions buyers ask about this
How accurate should a sales forecast be?
It depends on how many deals the quarter rests on. With honest odds, a quarter of 20 deals of €75k misses its expected value by about 27% on average, against about 9% for 200 deals of €7.5k (Illustrative, Panelhop calculation). Judge your forecast against the miss your own deal count predicts rather than a borrowed ±5%.
What’s the difference between a forecast and a pipeline?
The pipeline is every open deal and its value. The forecast is how much of that you expect to close in a set period, which depends on each deal’s odds, its close date and how many deals there are. A pipeline can grow while the forecast it supports gets less reliable, for example when stalled deals stay open.
How do we close out no-decision deals without losing them?
Close them with “no decision” as the reason instead of deleting them, so the contacts and history stay on the record. Set a task to check back with the buyer, and reopen the deal the day they re-engage. The forecast stops counting it; the relationship carries on.
How many deals does a quarter need before one forecast number is reliable?
There’s no fixed cutoff. Put your deal count N and win rate p into √((1 − p) ÷ (N × p)): at 30% odds, 20 deals give a typical spread of about ±34% and 200 deals about ±11% (Illustrative, Panelhop calculation). If the result is wider than the accuracy you’re asked for, commit a range.